
In the vast toolkit of a technical trader, the trendline is arguably the most fundamental yet powerful instrument. It’s more than just a line on a chart; it’s a dynamic portrait of market psychology, illustrating the battle between bulls and bulls. Drawing them correctly is an art, but interpreting them is a science.
Mastering trendlines can dramatically improve your timing for entries, exits, and risk management. Follow these steps to move from drawing random lines to trading with professional-grade trend analysis.
Step 1: Understand the “Why” Before the “How”
A trendline simply connects a series of highs or lows on a price chart to visually represent the trend’s direction and slope. Its core purpose is to identify support in an uptrend and resistance in a downtrend. It’s a graphical representation of the basic law of markets: supply and demand.
Step 2: The Right Way to Draw an Uptrend Line (Support)
An uptrend is defined by Higher Highs and Higher Lows. The trendline tracks the support level.
- Action: Find at least two significant swing lows (valleys where the price bounced up). The more touches, the more valid the line.
- Drawing: Connect these two lows with a straight line and extend it into the future.
- Pro Tip: The line should not be forced. It should naturally connect the lows, with the price action mostly staying above it.
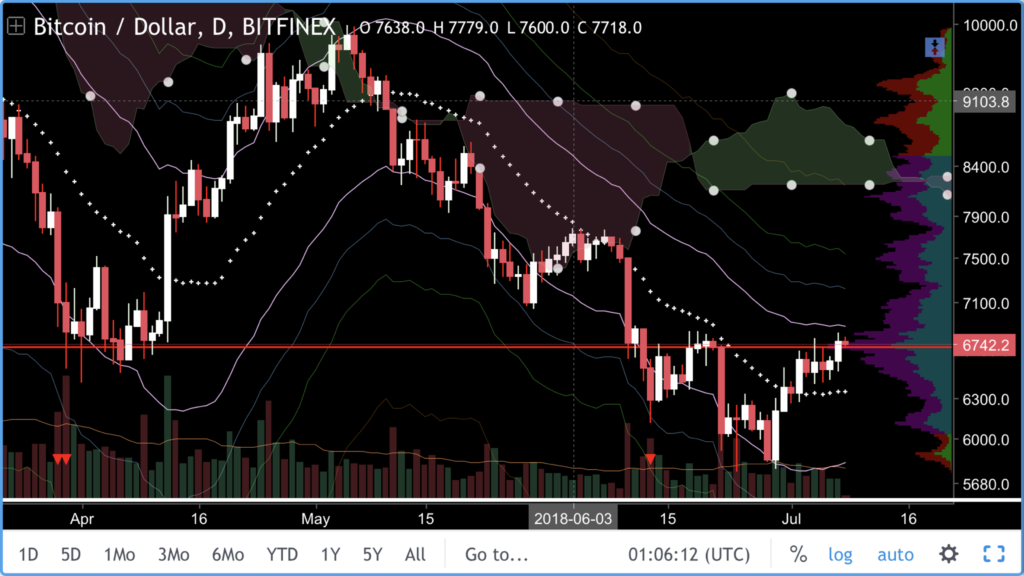
Visual Example: A Valid Uptrend Line
Step 3: The Right Way to Draw a Downtrend Line (Resistance)
A downtrend is defined by Lower Highs and Lower Lows. The trendline tracks the resistance level.
- Action: Find at least two significant swing highs (peaks where the price reversed down).
- Drawing: Connect these two highs with a straight line and extend it.
- Pro Tip: In a clean downtrend, the price will repeatedly approach this line and be rejected, continuing the downward move.
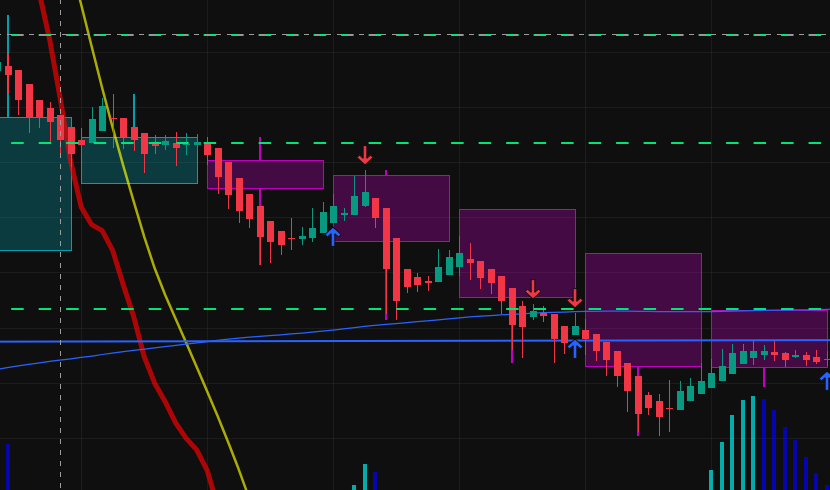
Visual Example: A Valid Downtrend Line
Step 4: Assess the Trendline’s Strength & Validity
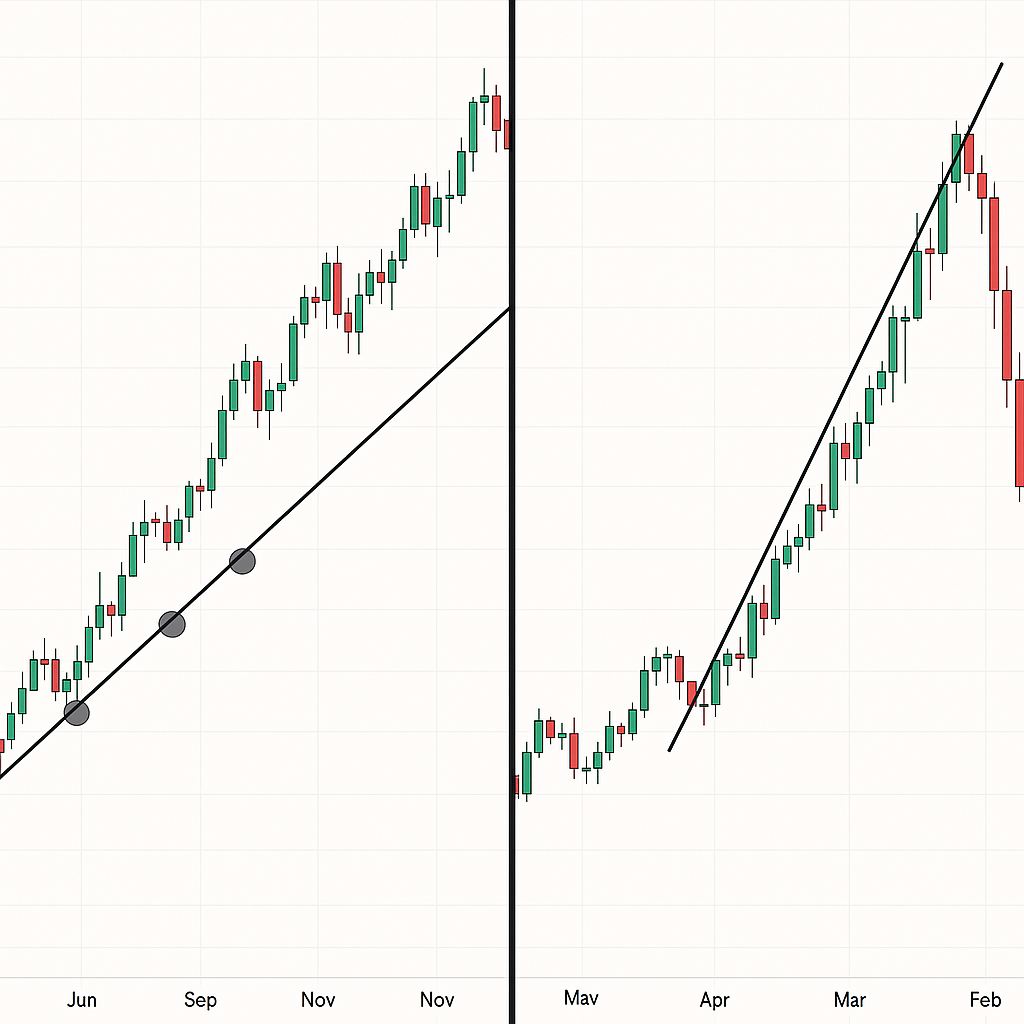
Not all trendlines are created equal. Their strength is determined by three key factors:
- Number of Touches: The magic number is three. Two points define a line, but the third (and subsequent) touch confirms its validity. More touches equal a stronger, more significant level.
- Time Frame: A trendline on a weekly chart is inherently more significant and reliable than one on a 5-minute chart. The longer the time frame, the more weight the level holds.
- Angle of Ascent/Descent: A very steep trendline is often unsustainable and prone to a sharp break. A more moderate slope (around 45 degrees is often cited) typically indicates a healthier, more stable trend.
Visual Example: Strong vs. Weak Trendline
Step 5: Trading the Breakout / Breakdown
The trendline’s primary job is to show you the trend, but its second job is to signal when that trend is ending. A break of the trendline is a major event.
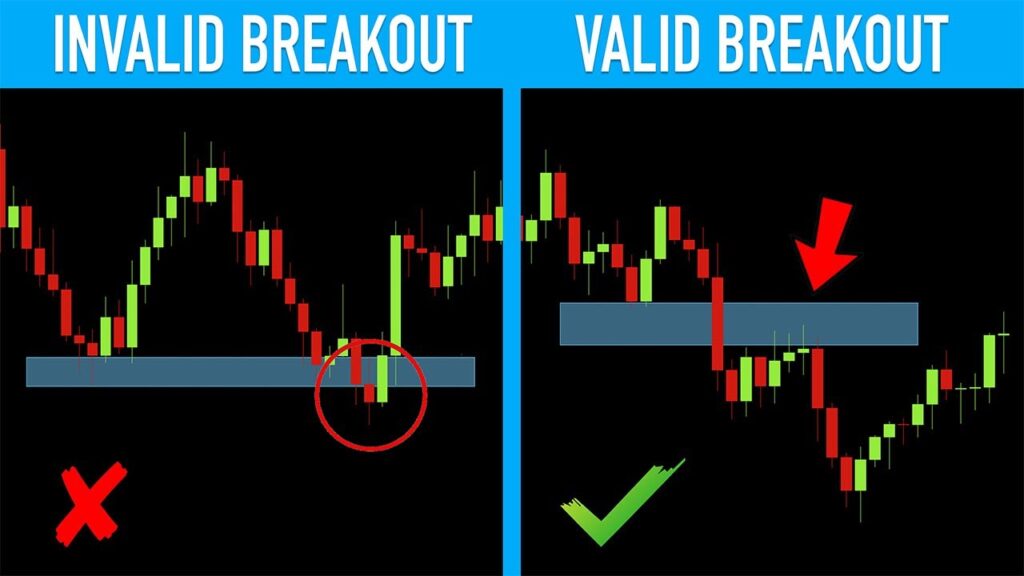
- The Signal: A decisive close above a downtrend line or close below an uptrend line signals a potential trend change.
- The Trap: Beware of “false breaks” or “whipsaws,” where the price briefly pierces the line only to snap back. This is why you wait for the close.
- Confirmation: Use other factors to confirm a break:
- Volume: A genuine breakout should be accompanied by a significant increase in trading volume.
- Momentum Indicators: Use an indicator like the RSI to see if it confirms the breakout (e.g., RSI breaking above 50 on an uptrend line break).
Visual Example: A Valid Breakout
Step 6: Advanced Application: Using Channels
Once you’ve mastered a single trendline, you can graduate to channels. A channel adds a parallel line to the original trendline, creating a trading range.
- Ascending Channel: Draw the main uptrend line (support), then draw a parallel line that connects the swing highs. This creates a channel where the price oscillates between support and resistance.
- Trading the Channel: Traders can buy near the lower support trendline and take profits/sell near the upper resistance trendline.
Visual Example: An Ascending Channel
Putting It All Together: The Pro Mindset
- Don’t Force It: If you can’t easily draw a trendline that connects multiple points, the trend might not be strong enough to trade.
- They Are Dynamic Support/Resistance: Unlike horizontal levels, trendlines are dynamic and move over time. Adjust them as new price action develops.
- Practice, Practice, Practice: The best way to learn is to open a chart and start drawing. Look at historical data and practice identifying trends and breaks.
Mastering trendlines is a journey from simple drawing to sophisticated interpretation. By following these steps, you transform a basic line into a powerful strategic tool, giving you a clear edge in reading the market’s story.
Disclaimer: This article is for educational and informational purposes only. It does not constitute financial advice or a recommendation to buy or sell any securities. All trading involves risk, and you should conduct your own research or consult a qualified financial advisor before making any investment decisions.


