
In the world of technical trading, price charts are the landscape, and chart patterns are the footprints left by the market’s collective psychology. Learning to read these footprints is a foundational skill that can help you identify potential opportunities and manage risk.
While dozens of patterns exist, mastering a handful of the most reliable ones is the key to starting your analysis. Here are five chart patterns that every technical trader should have memorized.
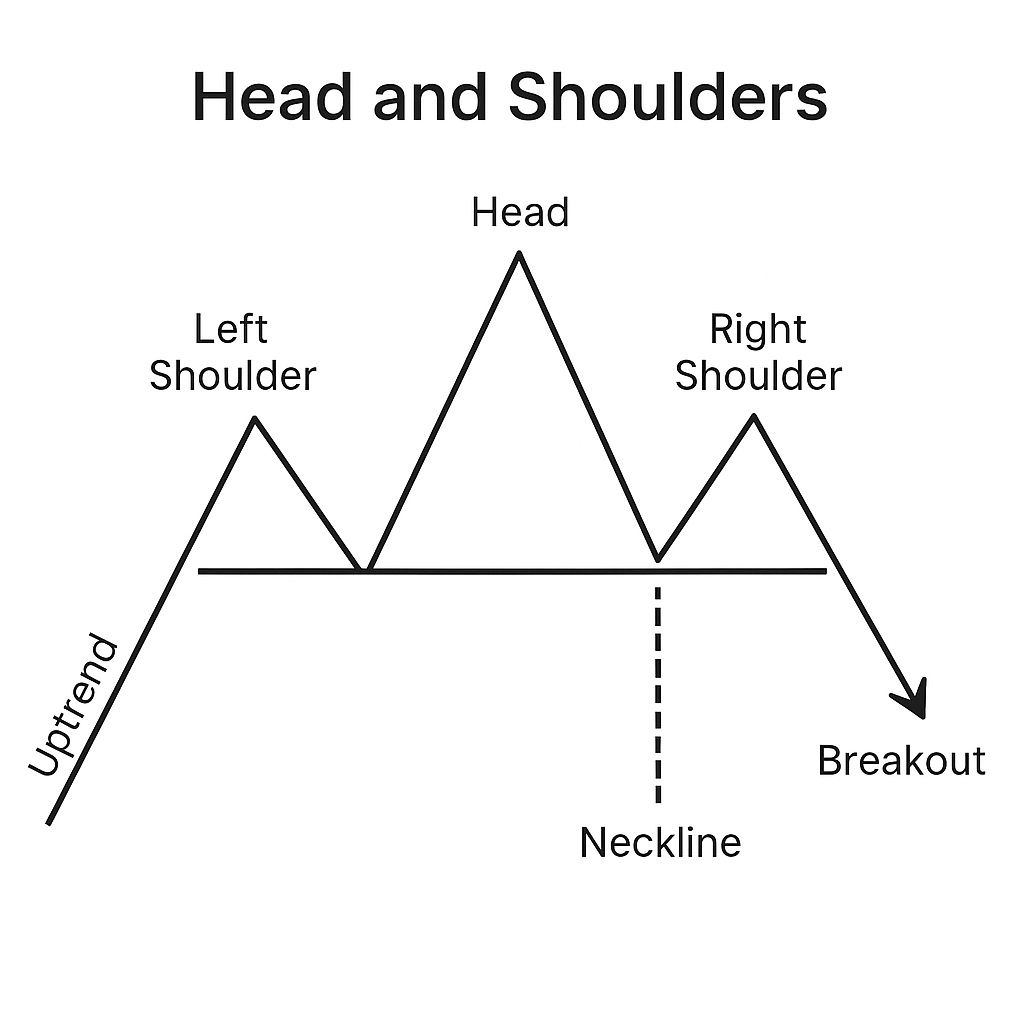
1. The Head and Shoulders (Trend Reversal Pattern)
What it is: The Head and Shoulders is one of the most reliable trend reversal patterns. It signals that an uptrend is likely ending and a new downtrend is beginning. Its inverse, the Inverse Head and Shoulders, signals the end of a downtrend.
How to Identify It:
- Left Shoulder: A peak followed by a decline.
- Head: A higher peak followed by a decline that retraces to a similar level as the previous decline (the neckline).
- Right Shoulder: A lower peak (cannot exceed the head) followed by a decline.
- Neckline: The support line connecting the lows after the left shoulder and head.
Trading It:
The pattern is confirmed when the price breaks below the neckline after the right shoulder. A common strategy is to enter a short position on this breakout. The price target is often estimated by measuring the distance from the top of the head to the neckline and projecting that distance downward from the breakout point.
Visual Example:
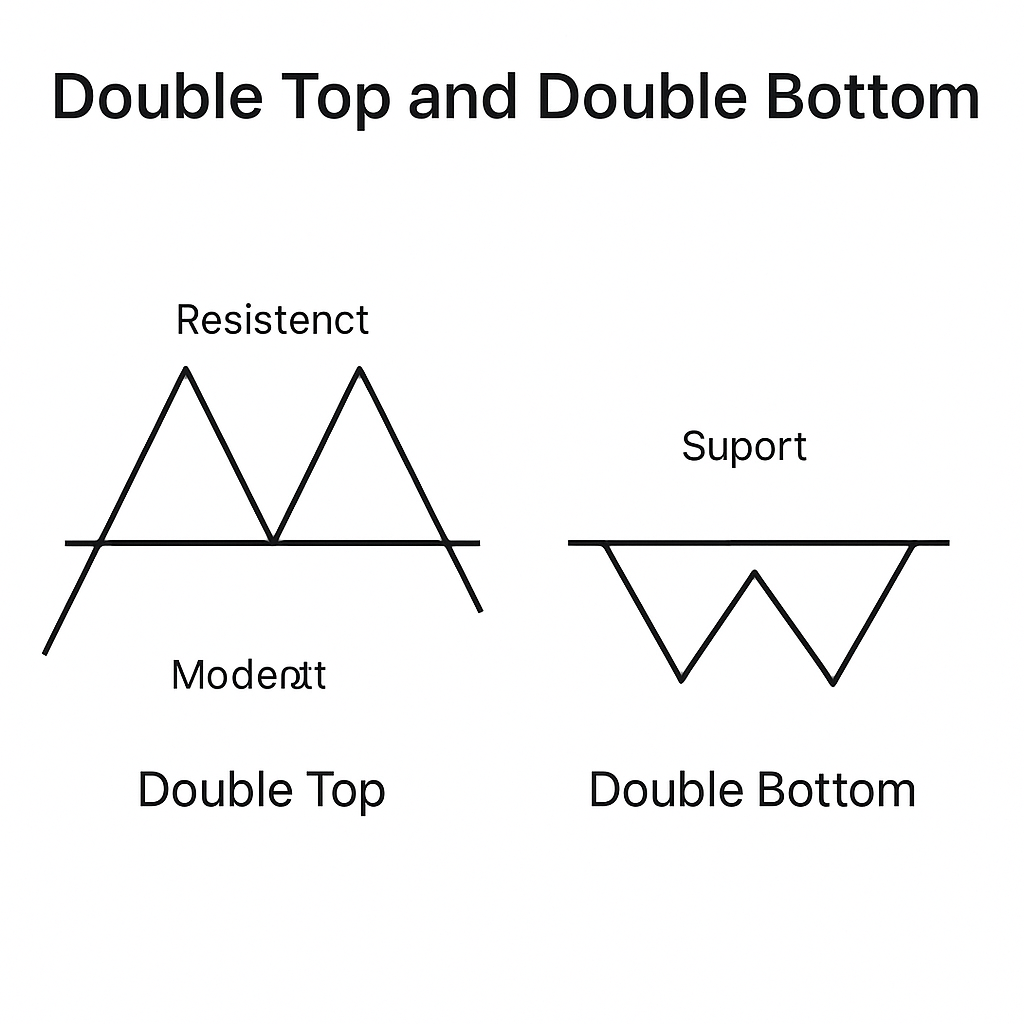
2. The Double Top and Double Bottom (Reversal Patterns)
What it is: These are simple yet powerful reversal patterns. A Double Top (shaped like an ‘M’) forms at the end of an uptrend. A Double Bottom (shaped like a ‘W’) forms at the end of a downtrend.
How to Identify It:
- Double Top: The price forms two distinct, roughly equal peaks at a resistance level with a moderate trough (the swing low) in between.
- Double Bottom: The price forms two distinct, roughly equal troughs at a support level with a moderate peak (the swing high) in between.
Trading It:
For a Double Top, the pattern is confirmed when the price breaks below the swing low between the two peaks. This acts as the neckline. The price target is typically the height of the pattern subtracted from the breakout point.
Visual Example:
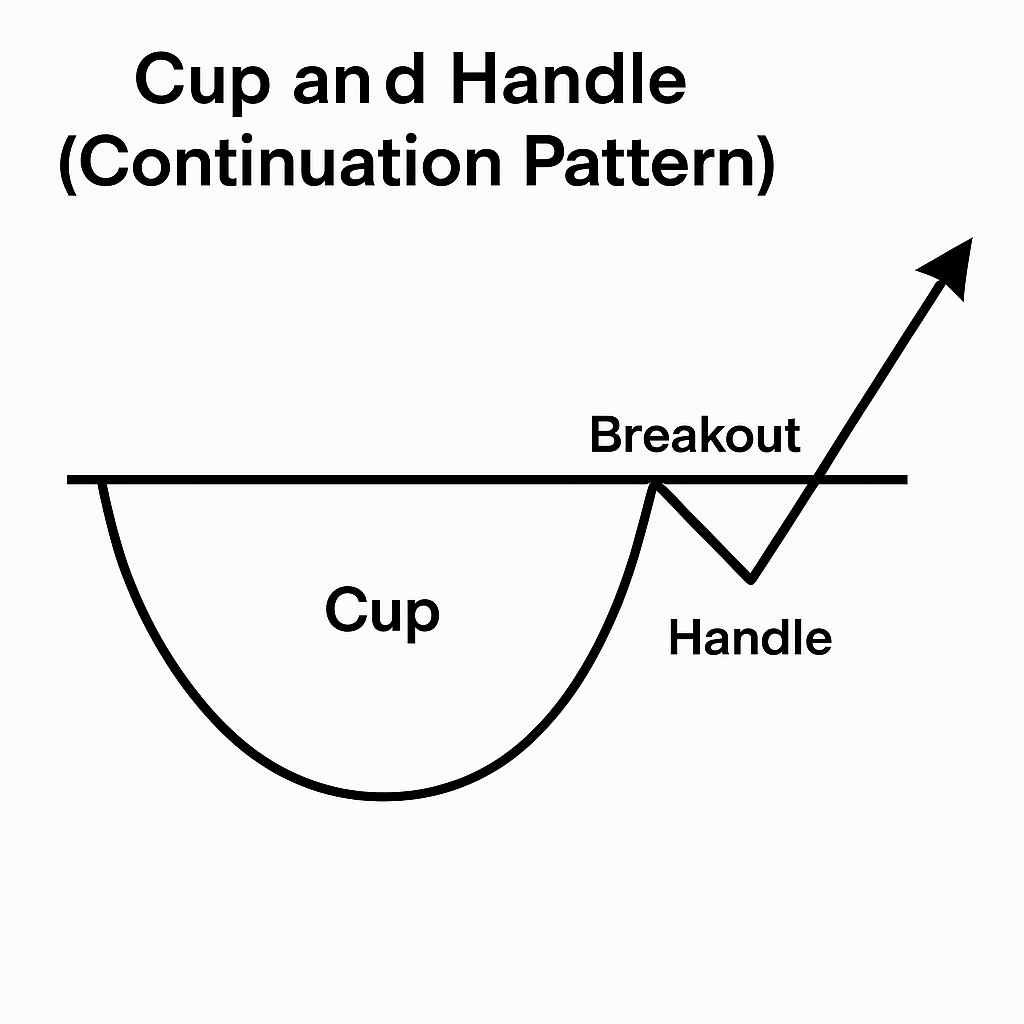
3. The Cup and Handle (Continuation Pattern)
What it is: A bullish continuation pattern that signifies a consolidation period before the prior uptrend resumes. It looks like a tea cup on the chart.
How to Identify It:
- The Cup: A gradual, U-shaped decline and recovery that resembles a bowl. The sides of the cup should be fairly symmetrical, not a sharp V-shape.
- The Handle: A small, downward or sideways drift that forms on the right-hand side of the cup. It represents a final shakeout of weak holders.
- Trend: The pattern should occur within an overall uptrend.
Trading It:
Traders typically enter a long position on a breakout above the upper trendline of the handle. The price target is often measured by taking the depth of the cup and adding it to the breakout point.
Visual Example:
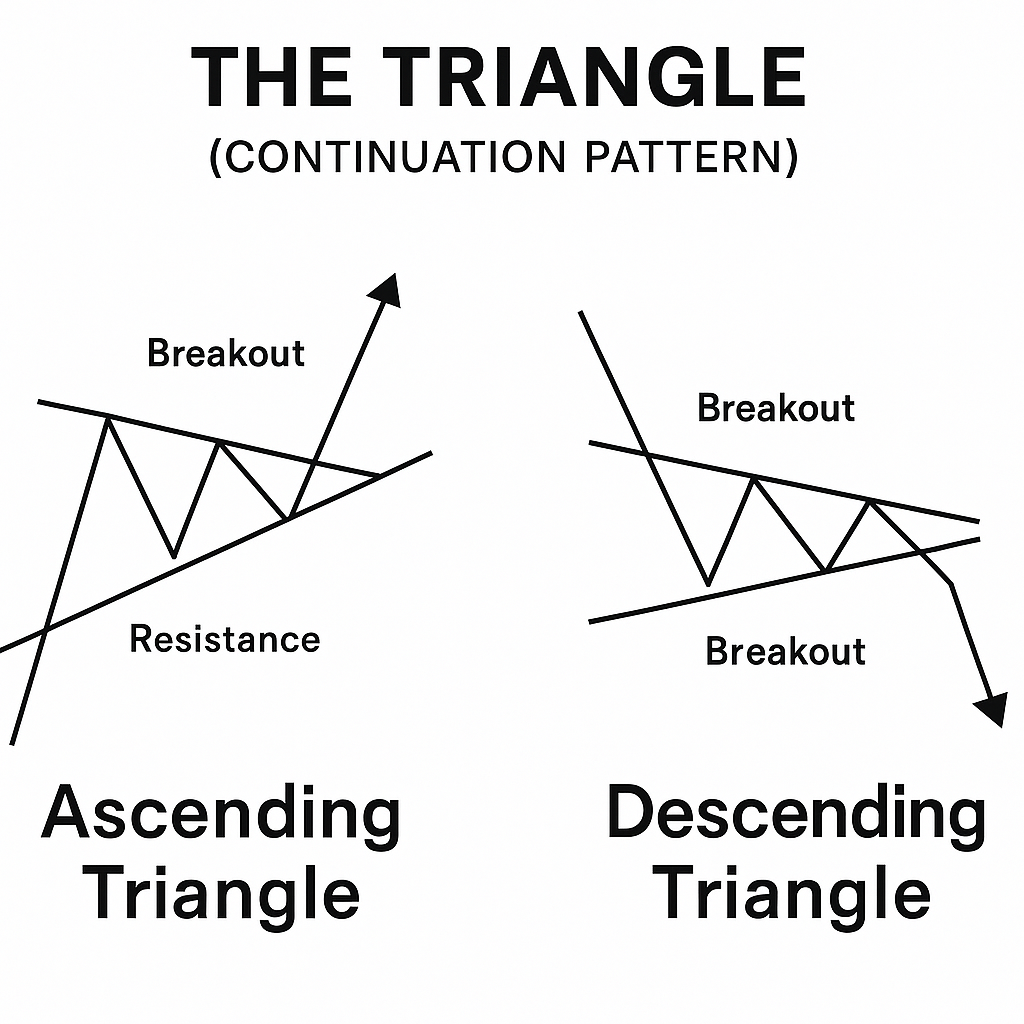
4. The Triangle (Continuation Pattern)
What it is: Triangles are consolidation patterns that represent a pause in the trend. There are three main types, but the Ascending Triangle (bullish) and Descending Triangle (bearish) are the most significant for forecasting direction.
How to Identify It:
- Ascending Triangle: A horizontal trendline connecting swing highs (resistance) and an ascending trendline connecting higher swing lows. This indicates buyers are becoming more aggressive.
- Descending Triangle: A horizontal trendline connecting swing lows (support) and a descending trendline connecting lower swing highs. This indicates sellers are becoming more aggressive.
Trading It:
The pattern is confirmed on a breakout in the direction of the prevailing trend. For an Ascending Triangle, anticipate an upside breakout. For a Descending Triangle, anticipate a downside breakout. The target is estimated by measuring the widest part of the triangle and projecting that distance from the breakout point.
Visual Example:
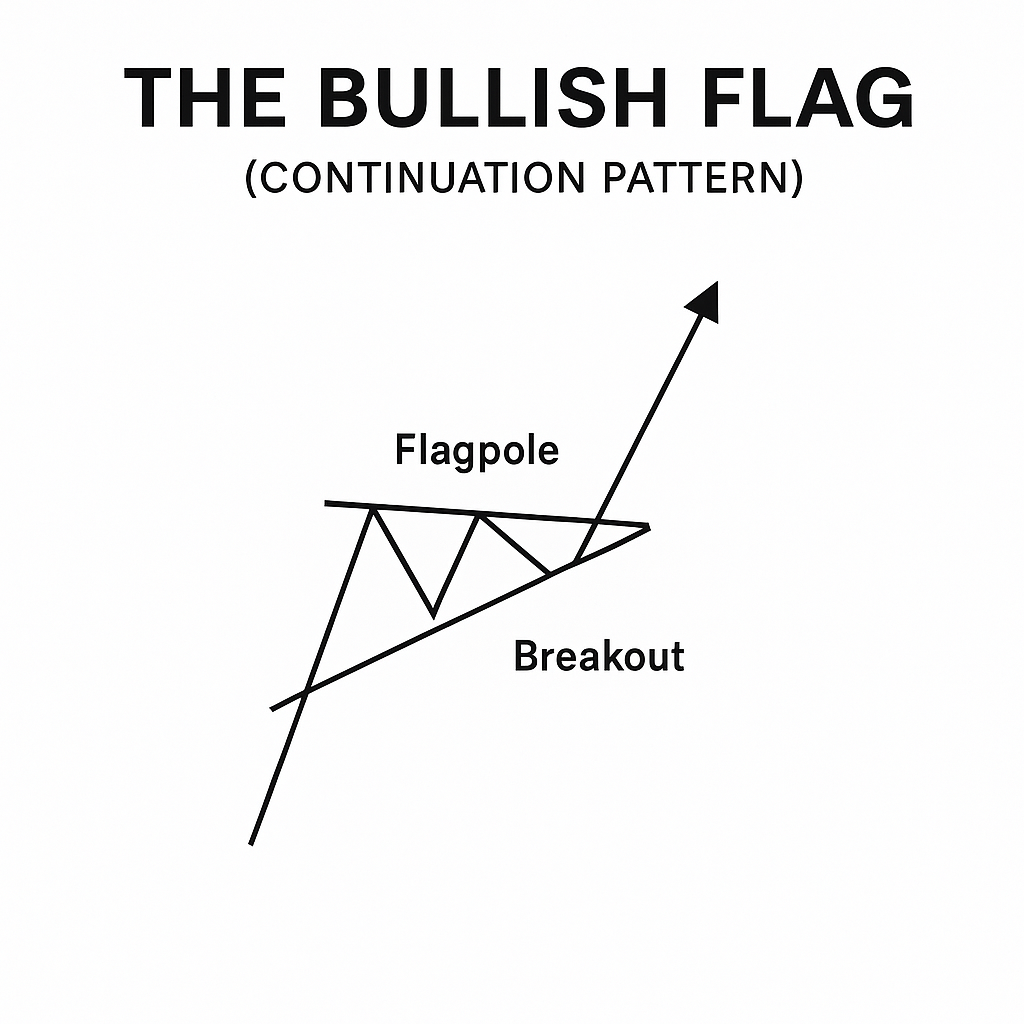
5. The Bullish and Bearish Flag (Continuation Pattern)
What it is: Flags are short-term, sharp consolidation patterns that occur after a strong, nearly vertical price move (the flagpole). They represent a brief pause before the trend continues.
How to Identify It:
- The Flagpole: A sharp, almost straight price advance (bullish) or decline (bearish).
- The Flag: A small, slanted rectangular consolidation that moves against the prevailing trend. A Bullish Flag slopes downward; a Bearish Flag slopes upward.
- Volume: Volume should be heavy during the flagpole’s formation and dry up significantly during the consolidation flag, then surge again on the breakout.
Trading It:
The pattern is confirmed when the price breaks out of the flag consolidation in the original trend’s direction. The price target is often set by measuring the length of the flagpole and projecting that distance from the breakout point.
Visual Example:
Conclusion: Pattern Recognition is a Tool, Not a Crystal Ball
Memorizing these five patterns provides a powerful framework for analyzing the markets. However, remember:
- No pattern is 100% reliable. Always wait for the confirmation breakout before acting.
- Use patterns in conjunction with other indicators, like volume or moving averages, to strengthen your thesis.
- Always have a plan for risk management. Know where you will place your stop-loss (e.g., below the neckline for a Head and Shoulders) before you enter a trade.
Practice spotting these patterns on historical charts. With time, recognizing these footprints of market psychology will become second nature.
Disclaimer: This article is for educational and informational purposes only. It does not constitute financial advice or a recommendation to buy or sell any securities. Trading involves significant risk, including the potential loss of principal. You should conduct your own research and consider consulting with a qualified financial advisor before making any investment decisions.